No reliable data
Councils invest in public courts but can't see how they're used or how often.
Tennis court utilisation · Australia
Ludii sensors on tennis court nets turn every rally into real-time utilisation data, so councils and sporting bodies know exactly how public courts are used.
play | measured
01The problem
Councils invest in public courts but can't see how they're used or how often.
Manual counts and surveys are costly and incomplete. Reviews can take around 8 weeks.
Funding and maintenance get prioritised without evidence.
02How it works
Every hit becomes useful evidence, from the sensor on the net to the decisions your team needs to make.
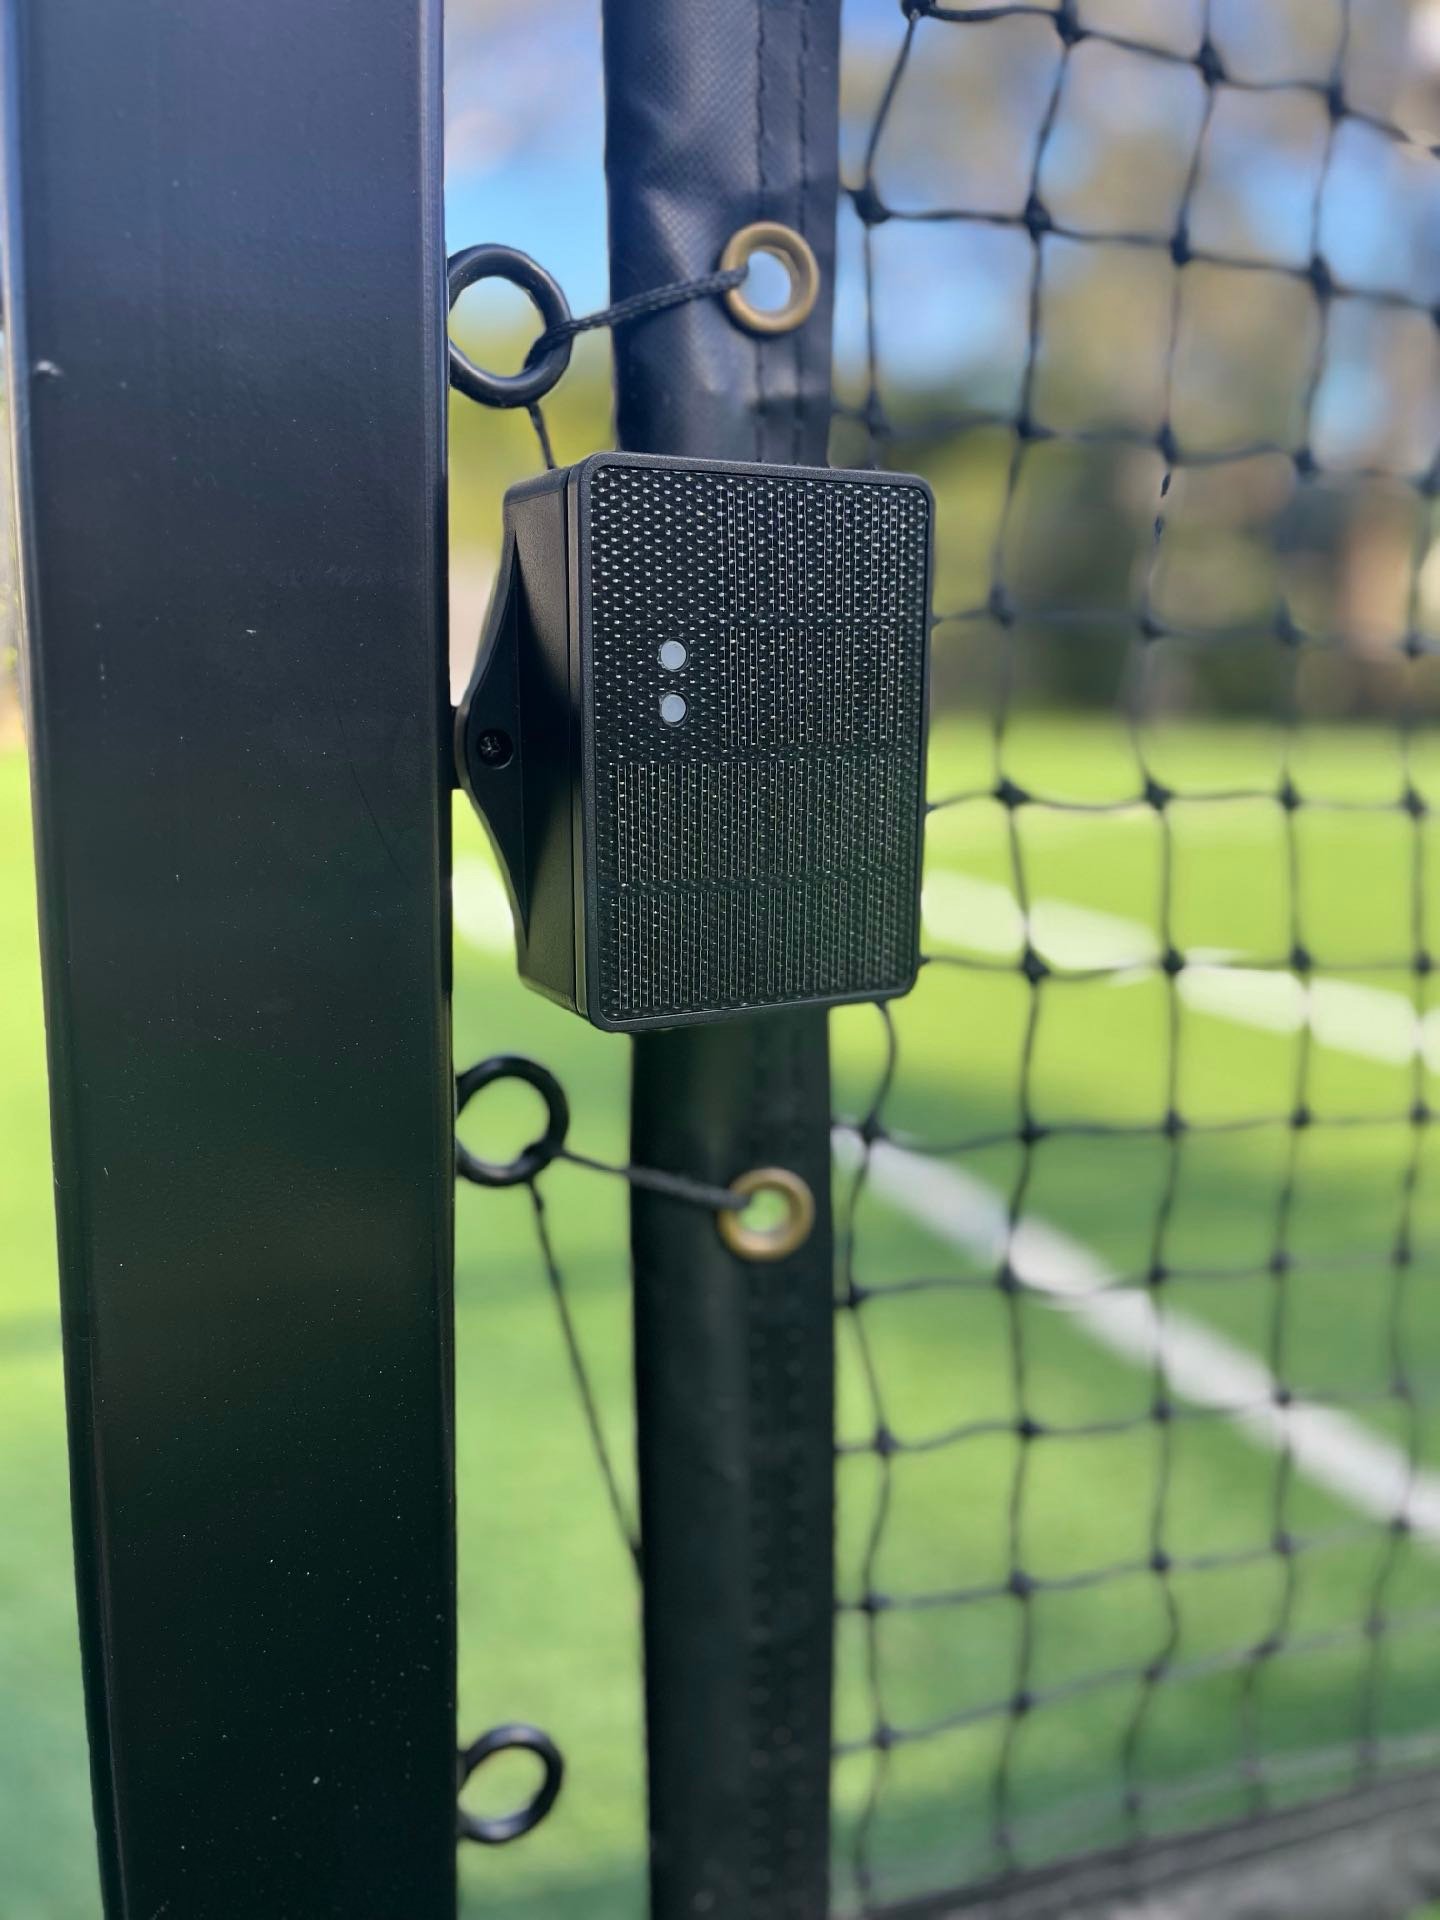
Solar-powered sensors attach to the net and record every hit.
Data travels over LoRaWAN to a nearby gateway.
Hits are filtered and translated into playing sessions.
Results land on a secure, role-based dashboard.
Teams use them to plan, fund and benchmark.
03See it in action
04The hardware
Rugged, self-powered and designed to live on a public court all year round.
Built-in solar panel
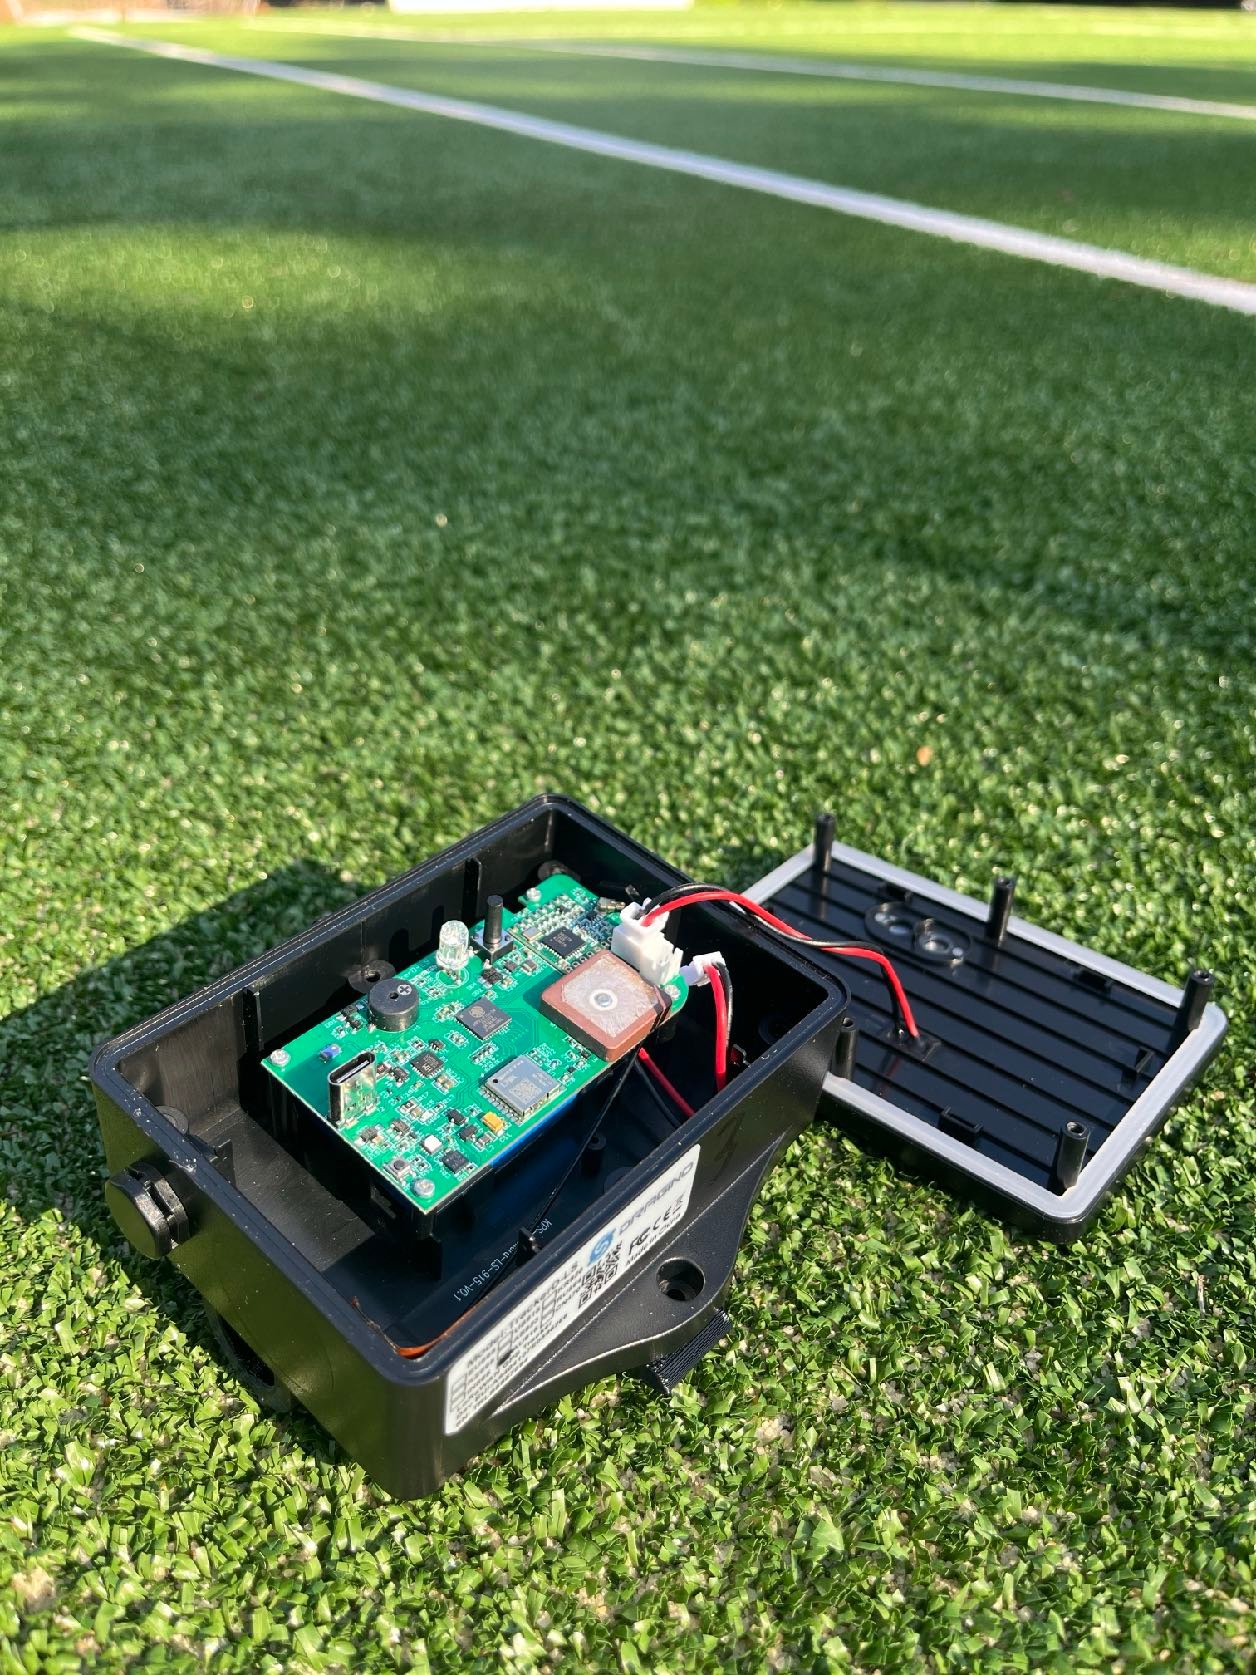
3000mAh Li-ion battery, 3× the original capacity
Tamper-resistant casing
Open-source hardware and software
LoRaWAN AU915 connectivity
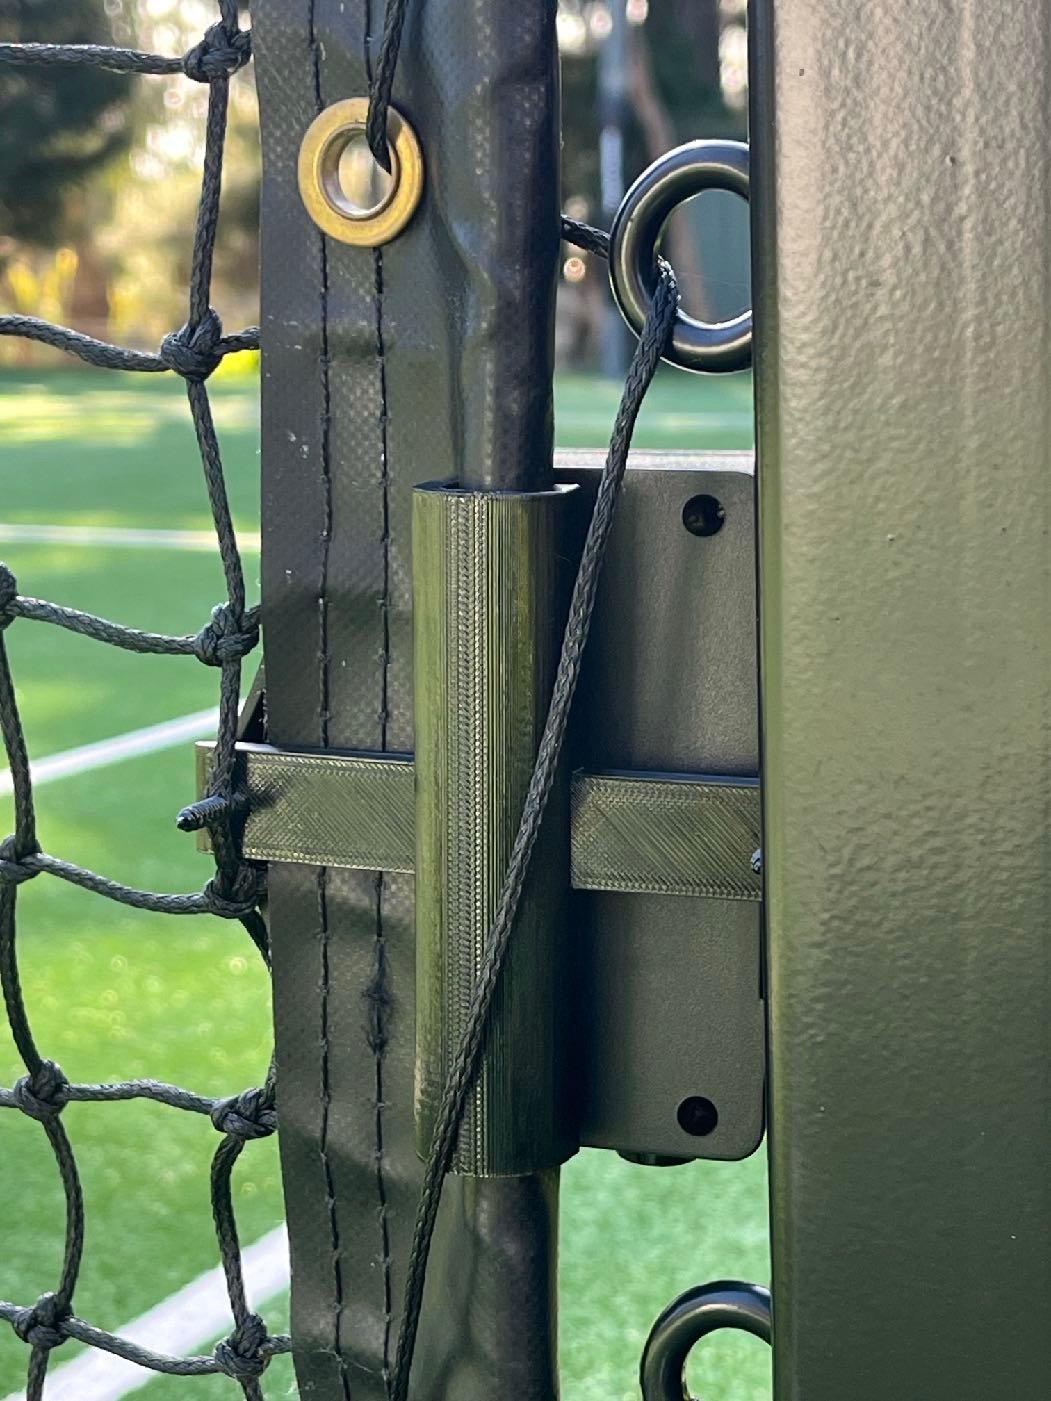
Installs in minutes with a bracket and two screws, without changing net tension
05Insights
Clear, comparable court data for planning, reporting and investment decisions.
Daily sessions per court, compared against other councils.
Average minutes played per court, per day.
Weekdays vs weekends, AM vs PM.
Playing patterns matched to Bureau of Meteorology historical data.
How utilisation shifts over weeks and months.
Sharper with every council added to the network.
06The platform
Council overview
Weekly court heatmap
Sessions / court / day
4.2
▲ 12% vs last month
AM / PM split
LGA comparison · illustrative
Sessions per court per day
07Pilot results
16
devices
6
sites
8 to 12
week field trial
3,300+
sessions recorded
The multi-site pilot tested durability, gateway connectivity, data accuracy, vandalism risk and utilisation over time.
81%
Up to 81% of sessions at some sites happen in the afternoon and evening. This is critical for lighting and maintenance planning.
08Partner with ludii
Devices are hired and stay maintained.
Your courts stay on the latest hardware.
Replaces slow, manual usage reviews.
Straightforward to approve and renew.
Now rolling out with state tennis associations across Australia.
09Contact
Tell us about your courts and we'll show you what ludii can measure.
Or email alex@codeblackconsulting.com.au